Navigation
Find Periodicity in Chlorophyl time series
Another example on how to detect periodicities in a Chlorophyl time series.
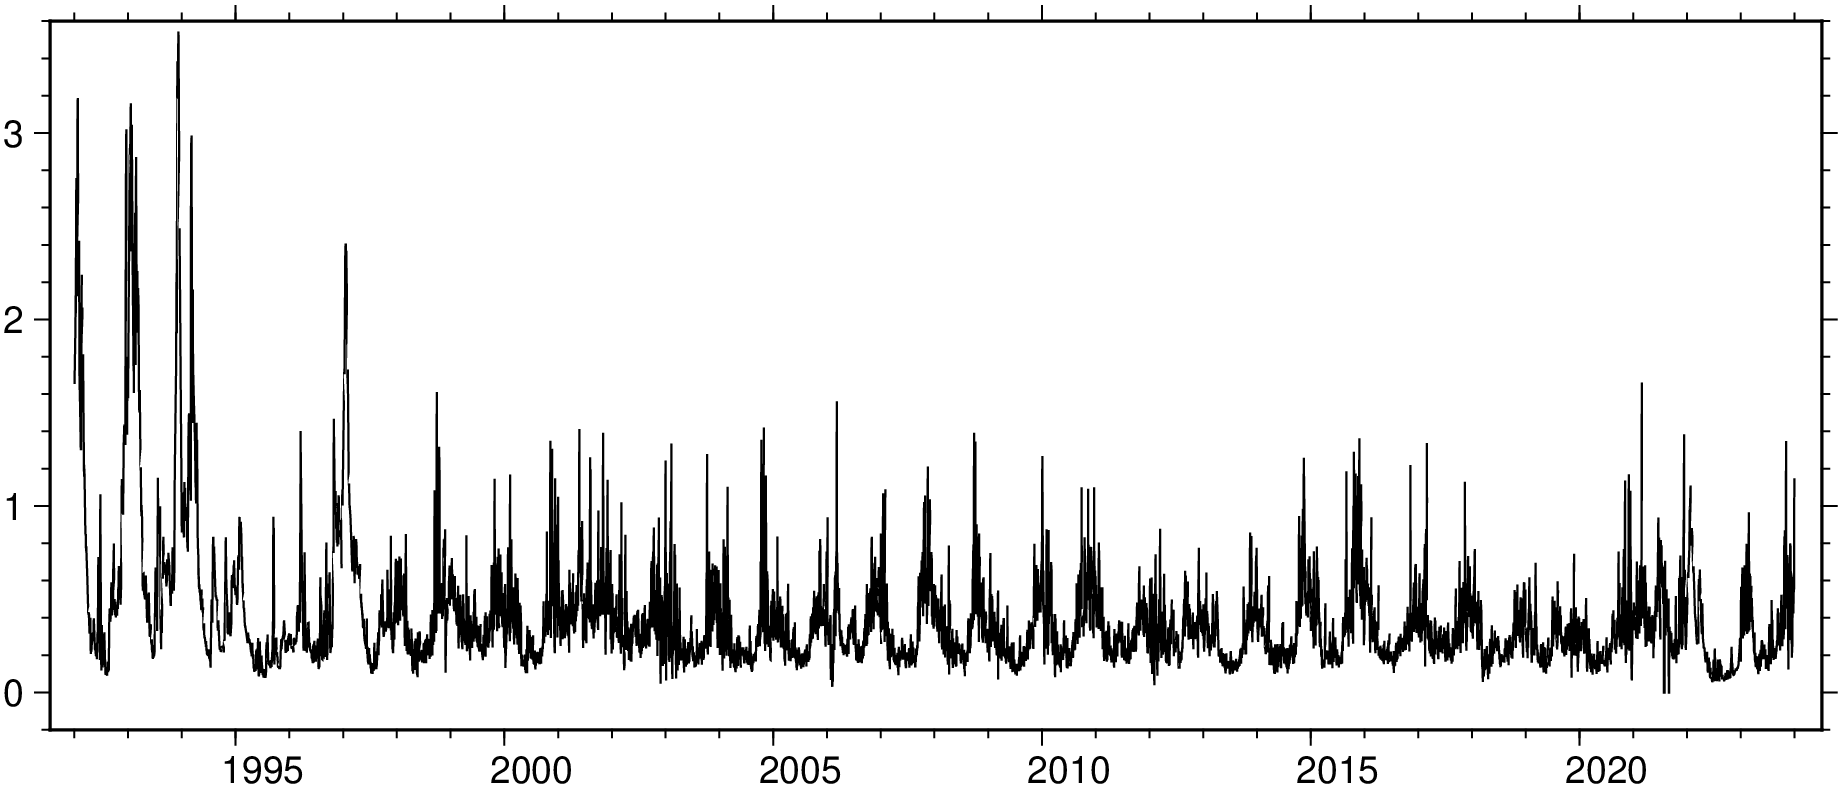
Load the data file with the chlorophyll concentration file.
using GMT

D1 = gmtread(TESTSDIR * "assets/cmems_mod_blk_bgc-plankton.csv");
viz(D1, figsize=(15,6))
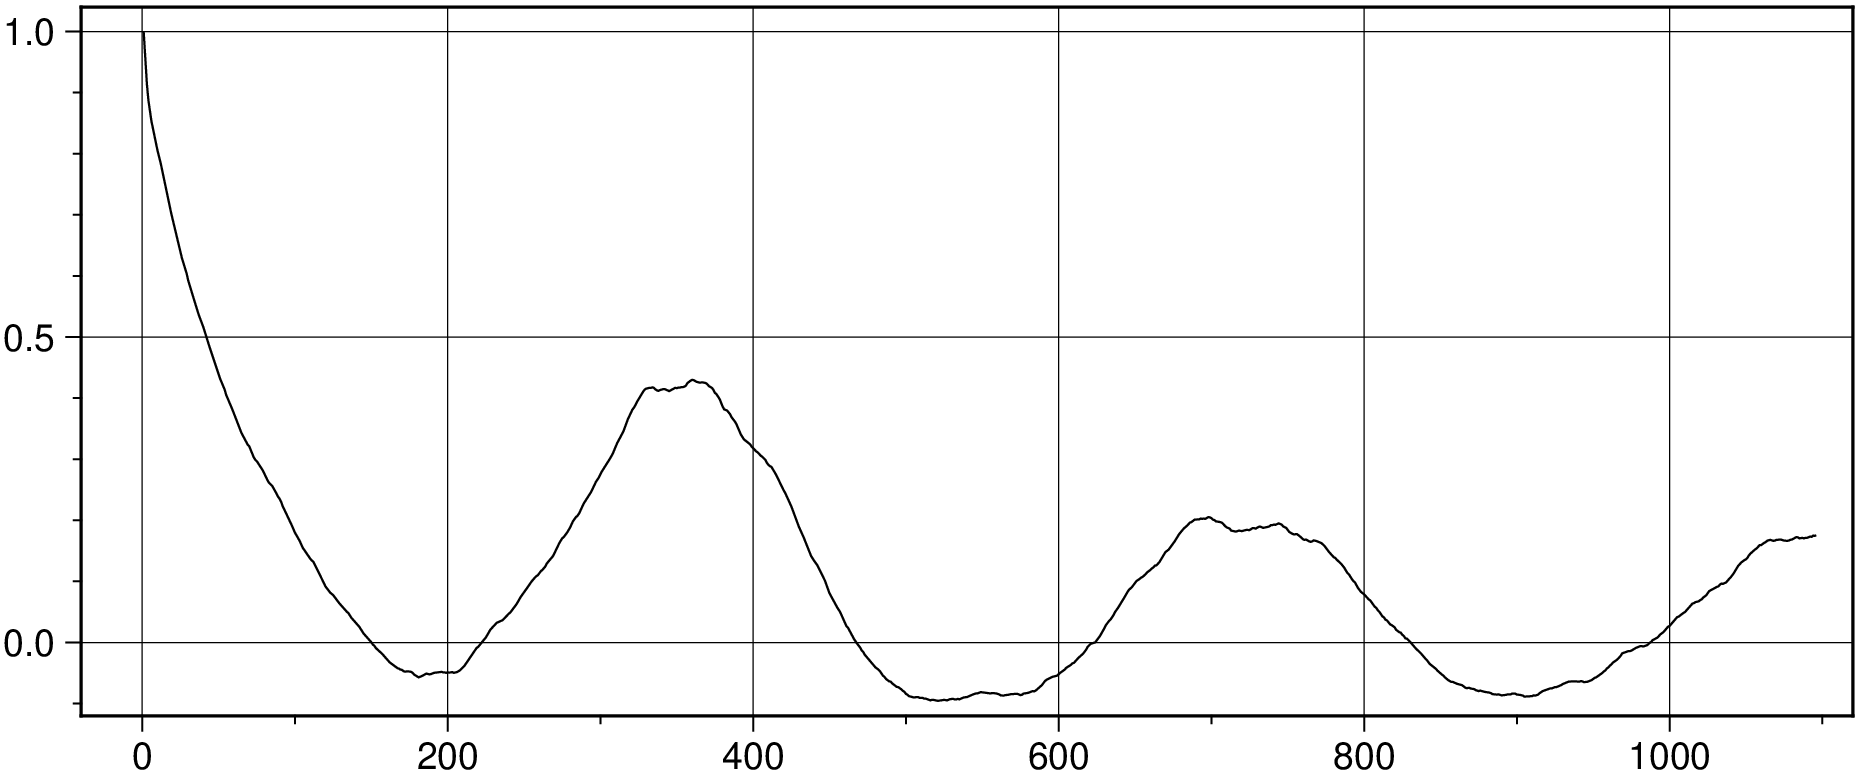
Create the lags vector. This case is simple as data points were collected one every day (less the missing days), so we use a lag interval of 1, extended over 3 years.
lags = 0:3*365;Now, compute the autocorrelation of the data using the autocor function. But, we want to pass it only the chlorophyll data that is stored in the second column of D1
ac = GMT.autocor(D1[:,2], lags)Show the autocorrelation values in a plot. The x-axis represent be the lags, and the y-axis should be the autocorrelation value.
ac = GMT.autocor(D1[:,2], lags)
viz(ac, figsize=(15,6), grid=true)
© GMT.jl. Last modified: September 05, 2025. Website built with Franklin.jl and the Julia programming language.
These docs were autogenerated using GMT: v1.33.1